1. Subscription Metrics (MRR, ARR, Churn, etc.)
Tracking subscription metrics is non-negotiable for subscription-based businesses. The most critical figures include:
- Monthly Recurring Revenue (MRR): This encompasses new subscriptions, upgrades, reactivations, downgrades, and cancellations.
- Annual Recurring Revenue (ARR): This provides a long-term view of revenue.
- Churn Rate: Understanding churn helps assess customer retention and satisfaction.
We recommend continuously tracking these metrics in real time to maintain a clear understanding of your subscription health.
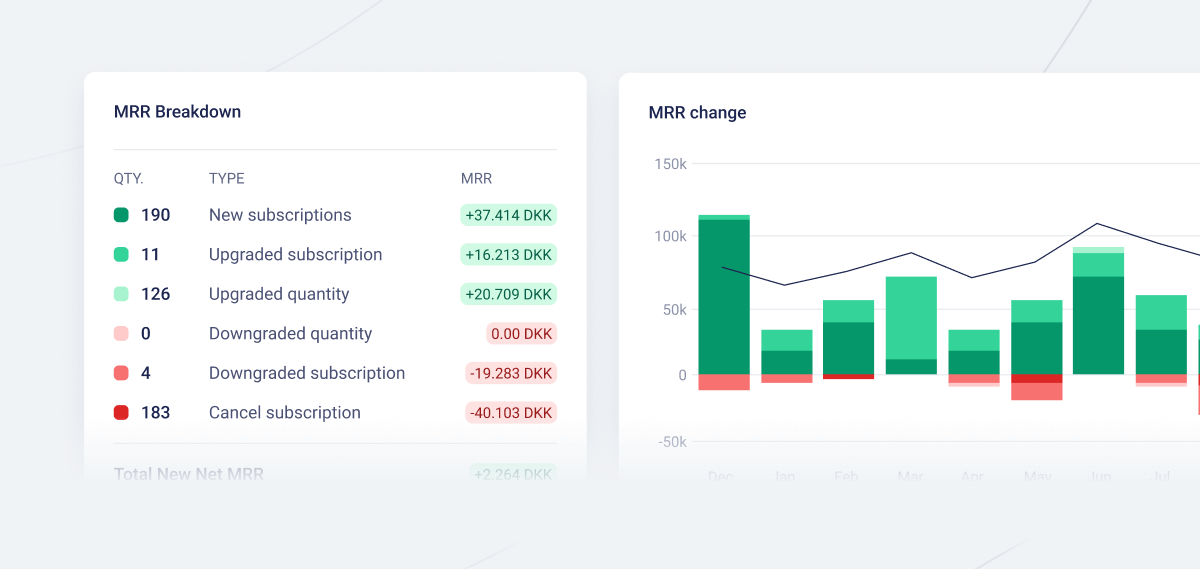 Fenerum dashboard showing SaaS churn and MRR Breakdown.
2. Average Revenue Per Account (ARPA)
ARPA is a critical metric that reveals the average revenue generated from each customer. Monitoring this figure enables the board to evaluate the efficiency of customer acquisition and upselling strategies.
- A rising ARPA indicates effective upselling or acquisition of higher-value clients.
- Conversely, a declining ARPA may signal issues with pricing or customer retention that need to be addressed.
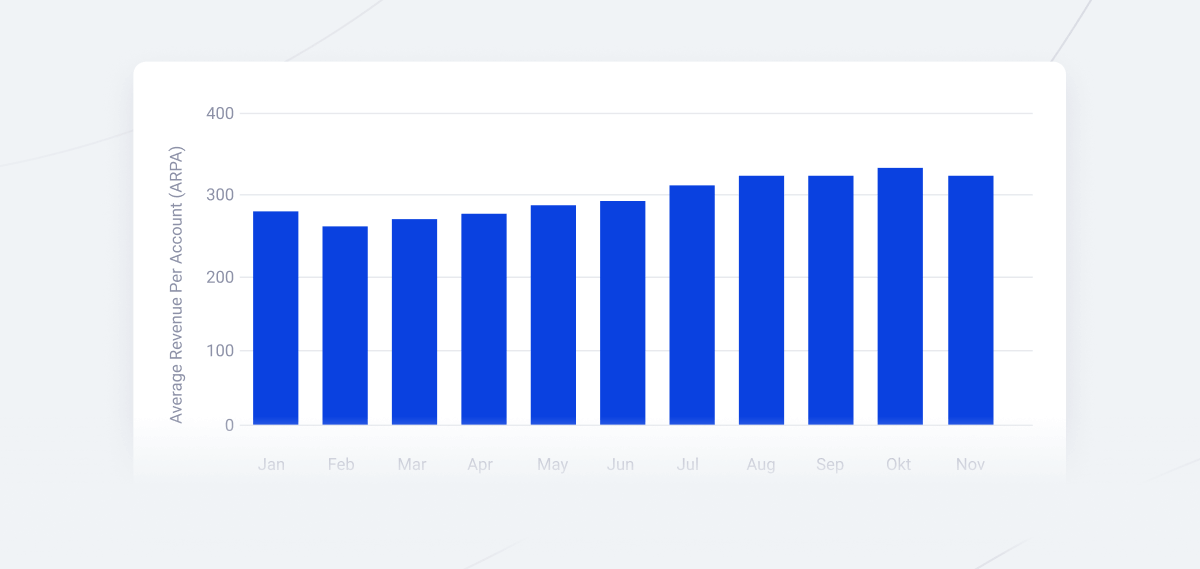 Fenerum chart showing Average Revenue Per Account (ARPA).
3. Profit and Loss (P/L) vs. Budget
Profit and Loss statements provide an overview of your company’s revenue and expenses. Comparing this data against your budget is crucial to ensure that the business is generating profits in alignment with your financial goals.
Tracking P/L vs. Budget shows whether you’re operating within your financial plan or if there are deviations that need correction. Significant variances will require further analysis and possibly strategic adjustments to stay on track.
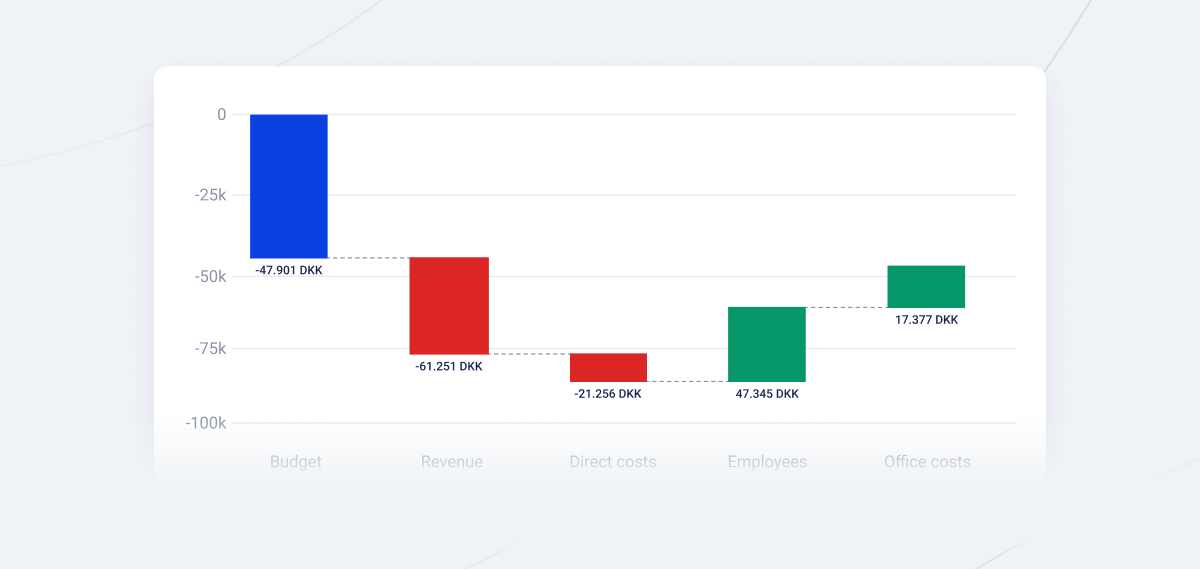 Fenerum chart showing Profit and Loss (P/L) vs. Budget.
4. Cash Flow
A healthy Cash Flow means you have enough funds to cover operational expenses, invest in growth opportunities, and weather unexpected challenges. Presenting a cash flow statement in your board report provides visibility into the money flowing in and out of the business.
- A positive cash flow suggests that the company is financially stable.
- A negative cash flow can signal trouble ahead, necessitating swift action.
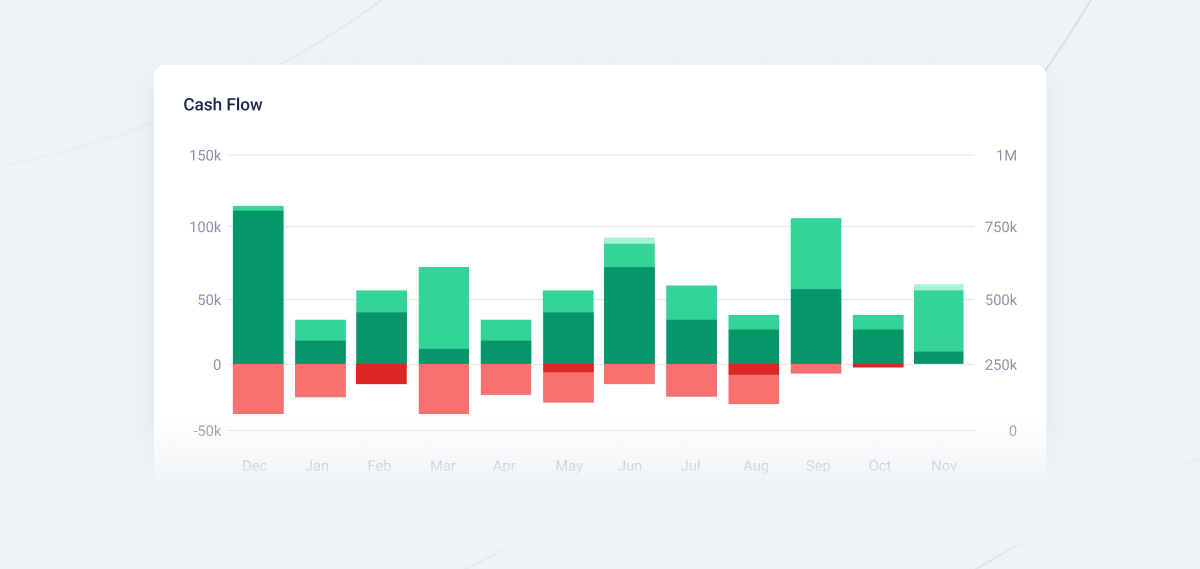 Fenerum chart showing SaaS cash flow.
5. Retention Cohort Analysis
Retention is one of the most critical aspects of any subscription business. A cohort analysis divides your customers into groups based on when they subscribed and tracks how many of them remain active over time.
This data helps the board understand customer loyalty, the effectiveness of your onboarding processes, and the long-term value of your clients. High retention rates often correlate with strong product-market fit and satisfied customers, while low retention indicates areas needing improvement, such as customer support or product offerings.
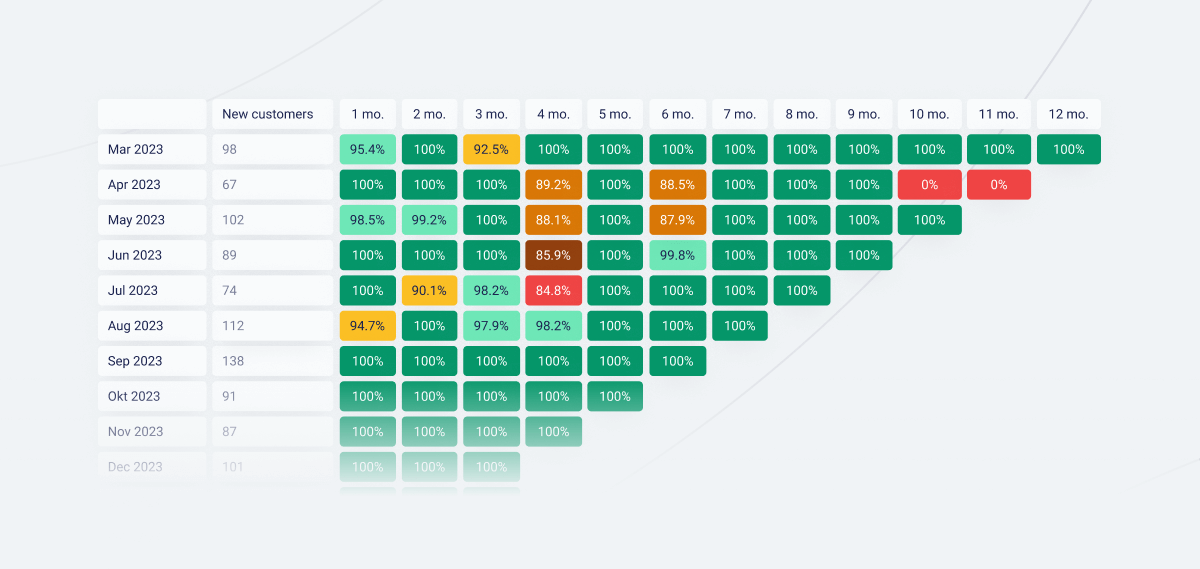 Fenerum retention cohort table.
Why a Strong Board Report Matters
A strong board report is key to gaining a clear overview of your company's performance, helping the board stay aligned with strategic goals. Whether you’re a startup or a well-established enterprise, presenting the right data in your board report is critical to ensuring the board understands the current financial health of the company and can offer informed guidance.
Automating this report can be a worthwhile investment, ensuring that you and your board always have a precise and real-time overview of the business. This enables informed decision-making and allows the board to provide the best counsel. If you use a subscription management tool like Fenerum, this process can be easily automated.
24 September 2024, By: Fenerum
